The American Association for the Advancement of Science (AAAS) is a respected scientific society dedicated to championing science and advancing public understanding of scientific knowledge. Its flagship publication, Science, is one of the world’s leading peer-reviewed journals, known for publishing groundbreaking research across a wide range of disciplines.
What began as a contract role right after graduation turned into one of the most rewarding chapters of my career. I started out focusing on photo editing—sourcing imagery to support editorial content and magazine layouts. Over time, my responsibilities evolved to include illustration, data visualization, and close collaboration with journalists across scientific fields, allowing me to translate complex ideas into compelling visual narratives.
Data Visualization
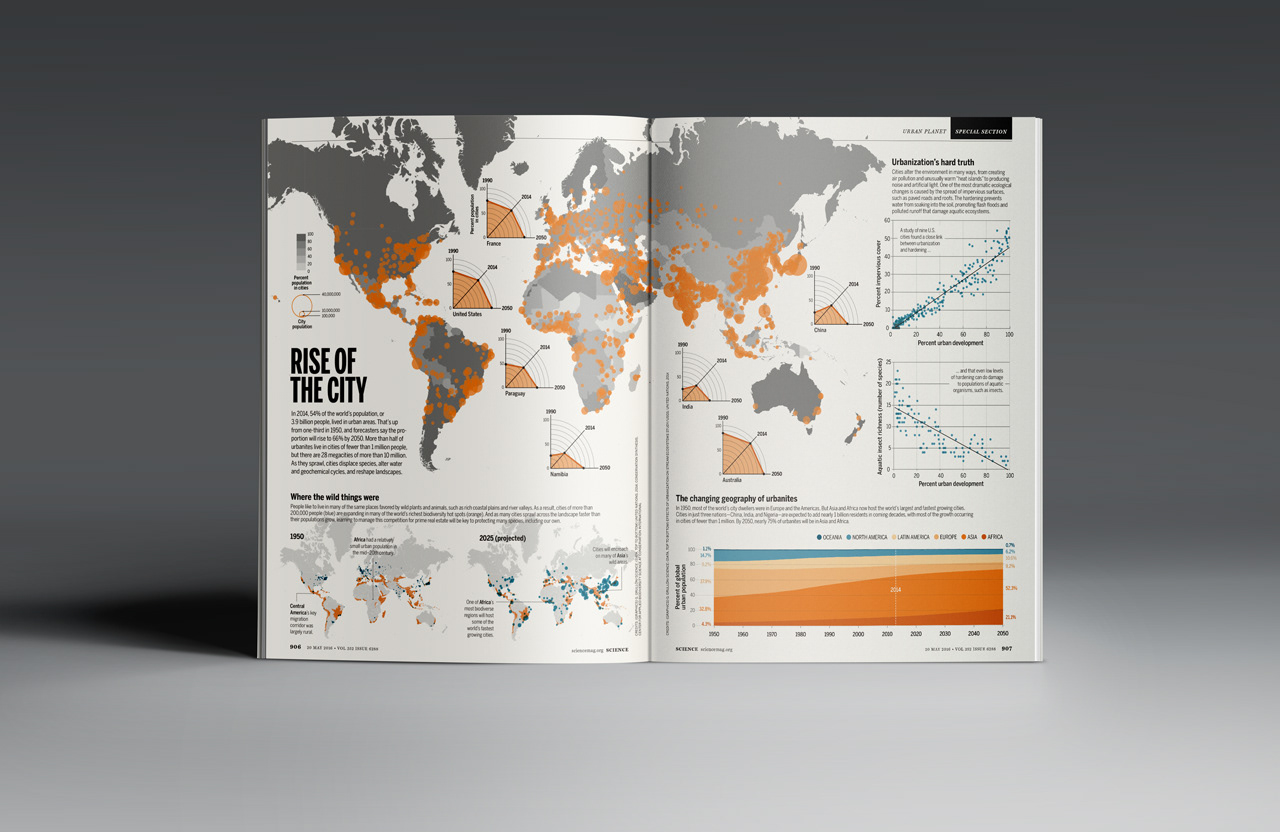
This spread served as the Intro page to a much deeper dive into how modern cities affect biodiversity in a Science special section called "Urban Planet".
Urban Planet
Science Special Issue
This graphic was created for Science magazine in collaboration with writer David Malakoff. It explores the impact of rapid urbanization around the world, using data to highlight current trends and project what may lie ahead.
Science Special Issue
This graphic was created for Science magazine in collaboration with writer David Malakoff. It explores the impact of rapid urbanization around the world, using data to highlight current trends and project what may lie ahead.
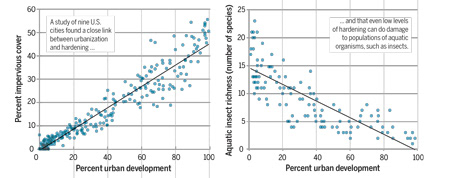
When we put all of the puzzle pieces together and cleaned up all of the data, what surfaced was that as towns and cities became more 'impervious', or covered their surrounding lands in substrates like pavement and cement, there was a sharp decline in surrounding aquatic insect populations.
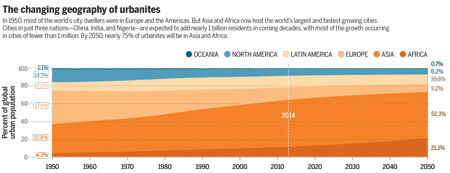
The data shows dramatic changes in urban populations. As towns evolve into large iterations of themselves and cities become mega cities, populations shifts will start to effect our day to day life all around the world.
Sci-Hub
Science Special Issue
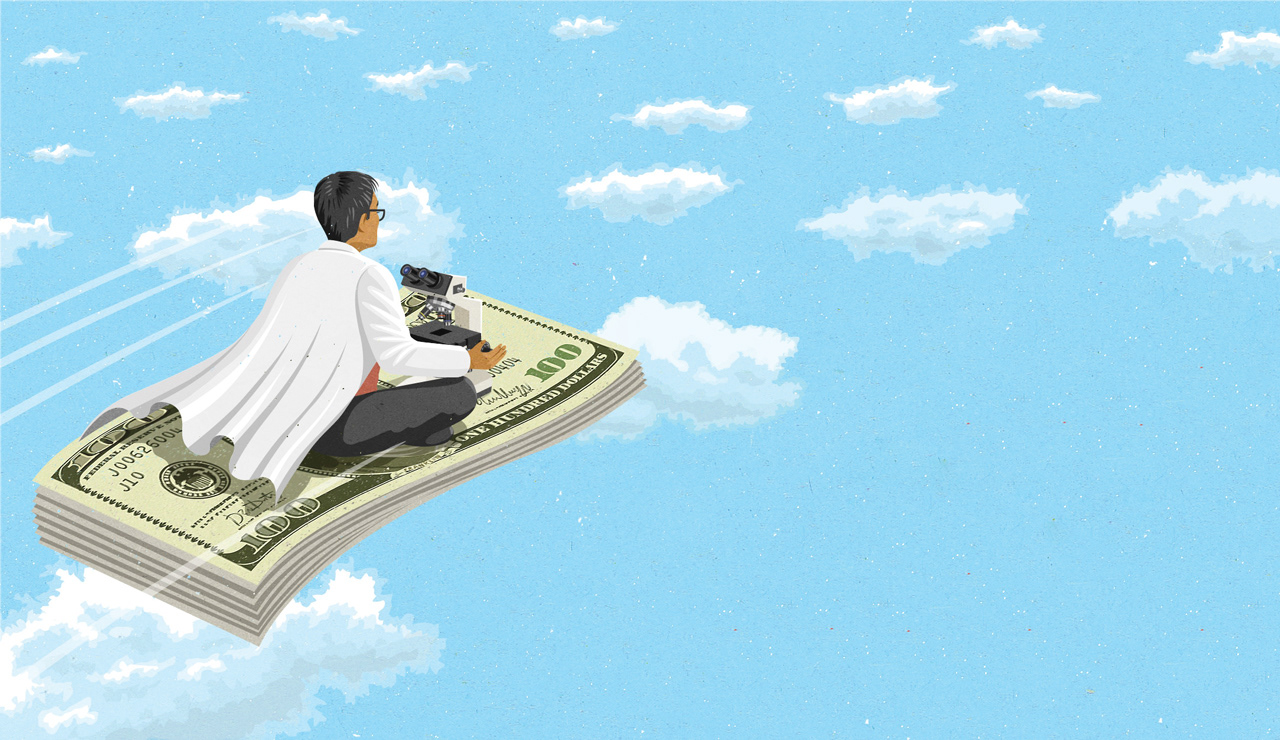
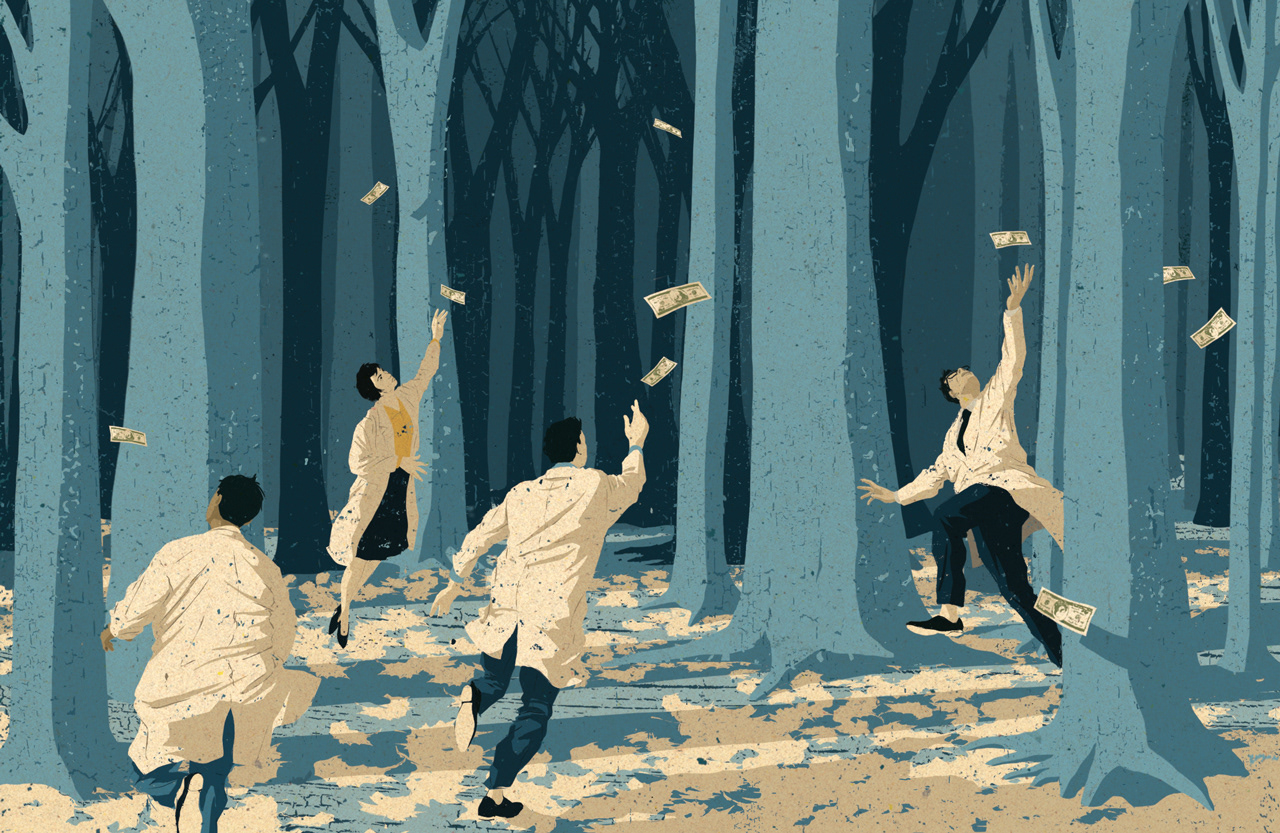
This layout and graphic were developed for Science magazine in collaboration with writer John Bohannon. The piece focused on Sci-Hub—a shadowy back channel offering free access to paywalled, peer-reviewed research papers. Our goal was to uncover which countries were using the tool most frequently—and what kinds of academic content they were seeking.
Science Special Issue
This layout and graphic were developed for Science magazine in collaboration with writer John Bohannon. The piece focused on Sci-Hub—a shadowy back channel offering free access to paywalled, peer-reviewed research papers. Our goal was to uncover which countries were using the tool most frequently—and what kinds of academic content they were seeking.

John recognized that the story lived in the data. Together, we sifted through and cleaned millions of records to uncover the insights we wanted to highlight.
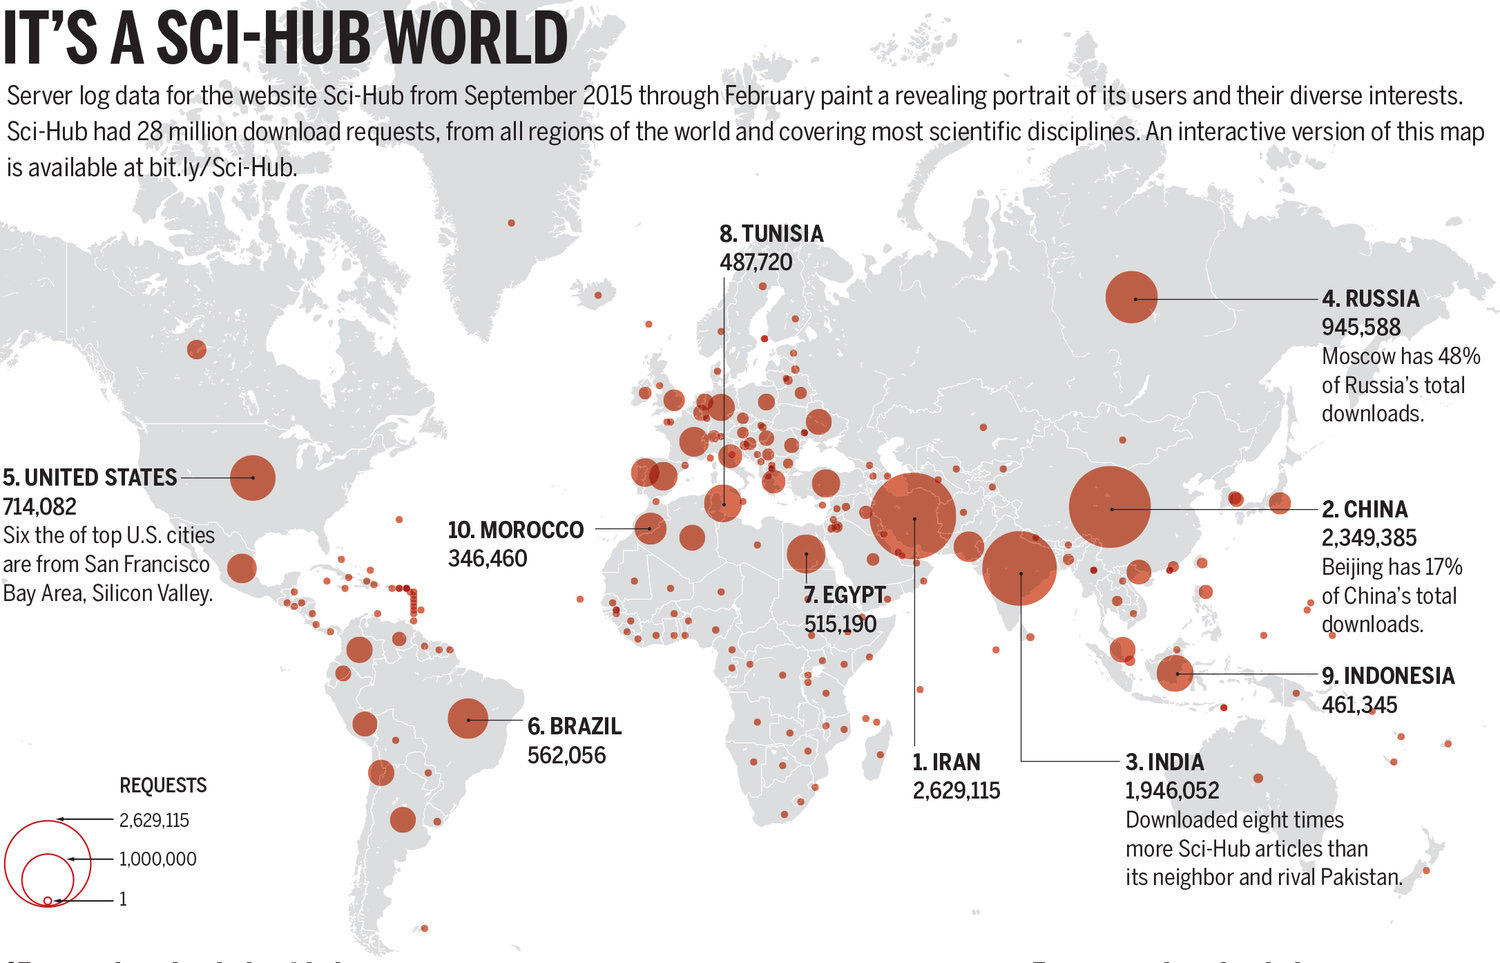
After we laid out all of the data, the patterns started to emerge. It was clear that Iran and China were, by far, downloading the most papers from around the world. We concluded that a symbol map would help make this information read very quickly, while also sharing what was happening in the rest of the world.
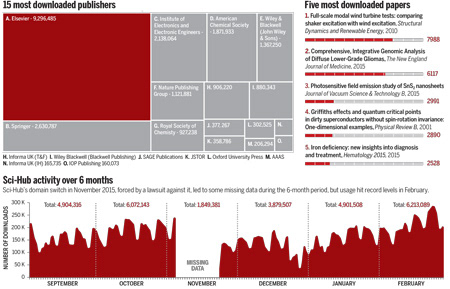
The data points to Elsevier as the most downloaded publisher by over half a million and a tree map really brings that point home. We also thought it would be interesting to plot the ebb and flow of traffic on the site - where you clearly see the drop off around the holidays.
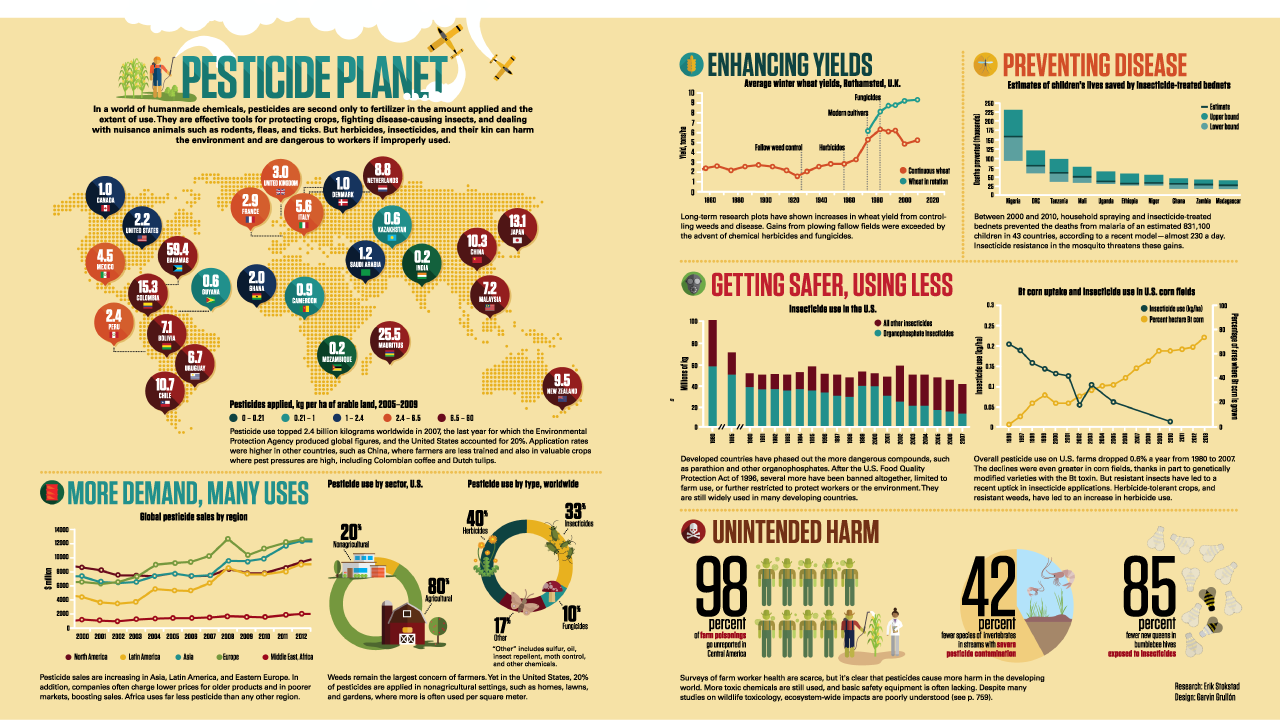
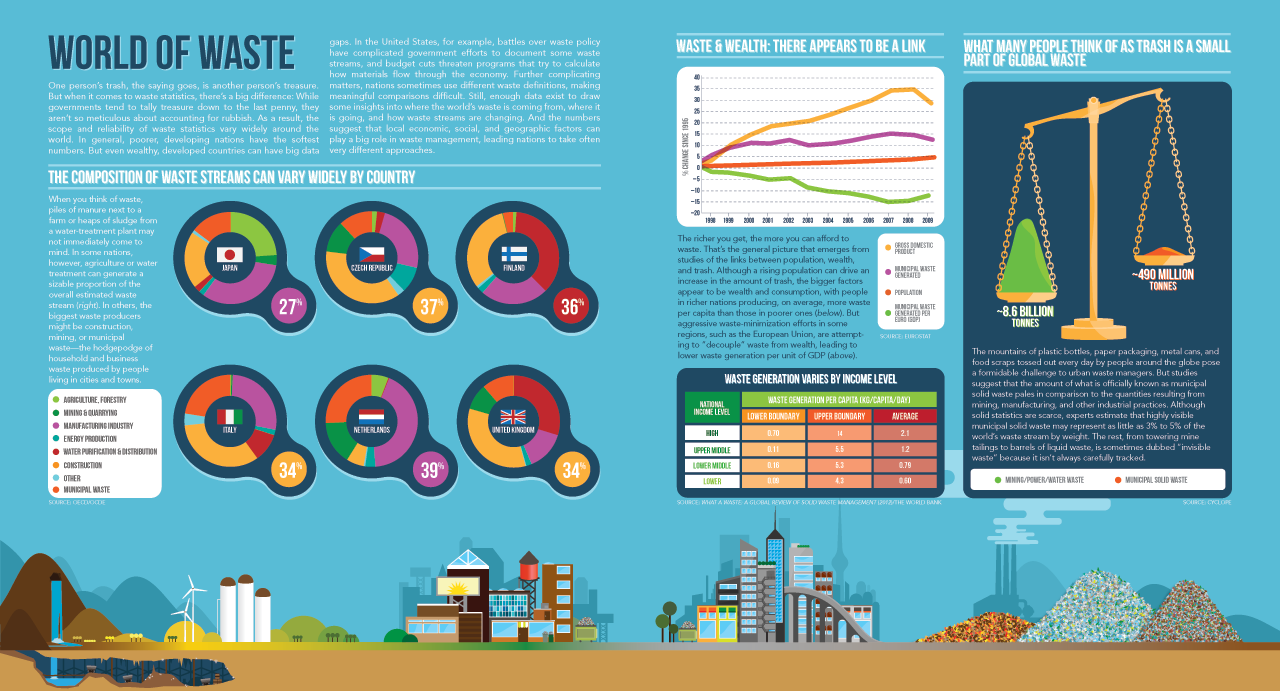
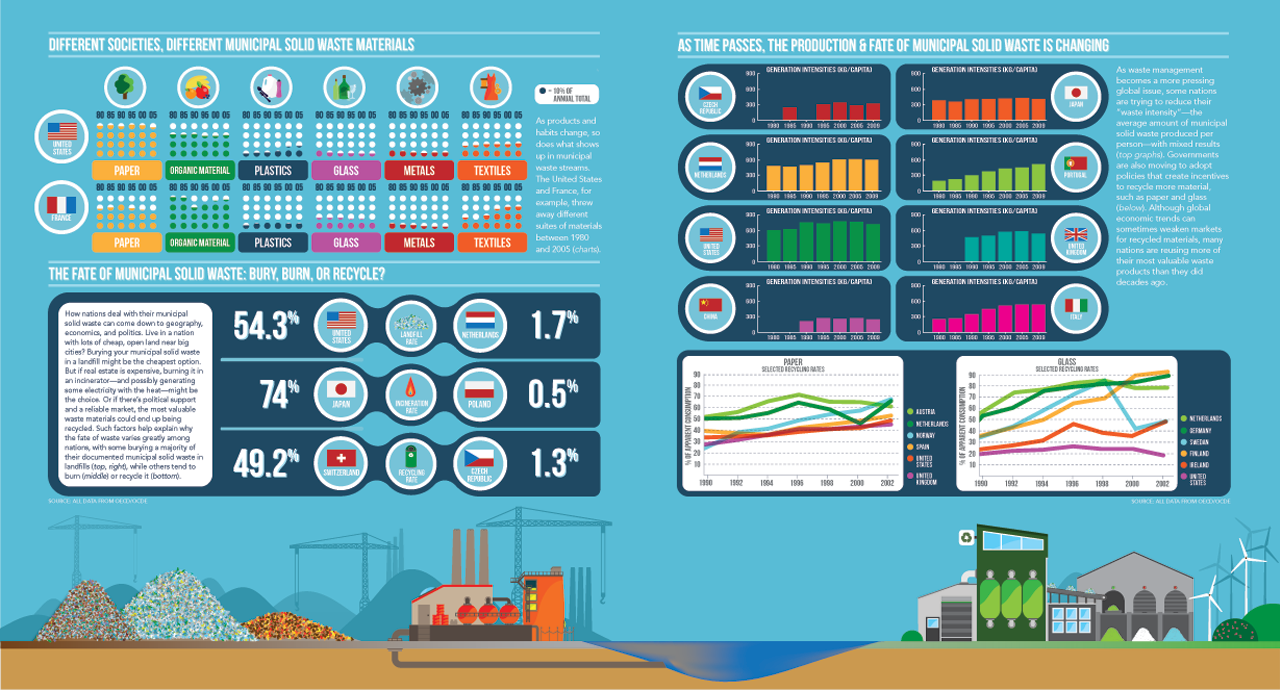
Colorful infographics designed for various Special Issues within the publication.
Publication Design

Managing Photo Editor: Bill Douthitt; Design Direction: Beth Rakouskas; Managing Graphic Editor: Alberto Cuadra; Design & Layout: Garvin Grullon
Technical Illustration


Combining my passion for data analysis with a love for Adobe Illustrator, I quickly became drawn to the precision and technical skill required to create visualizations for a publication like Science. Under the expert mentorship of Design Director Beth Rakouskas and Managing Graphics Editor Alberto Cuadra, I deepened my understanding of illustration and data storytelling—growth that ultimately led to my promotion to Graphics Editor in 2015.
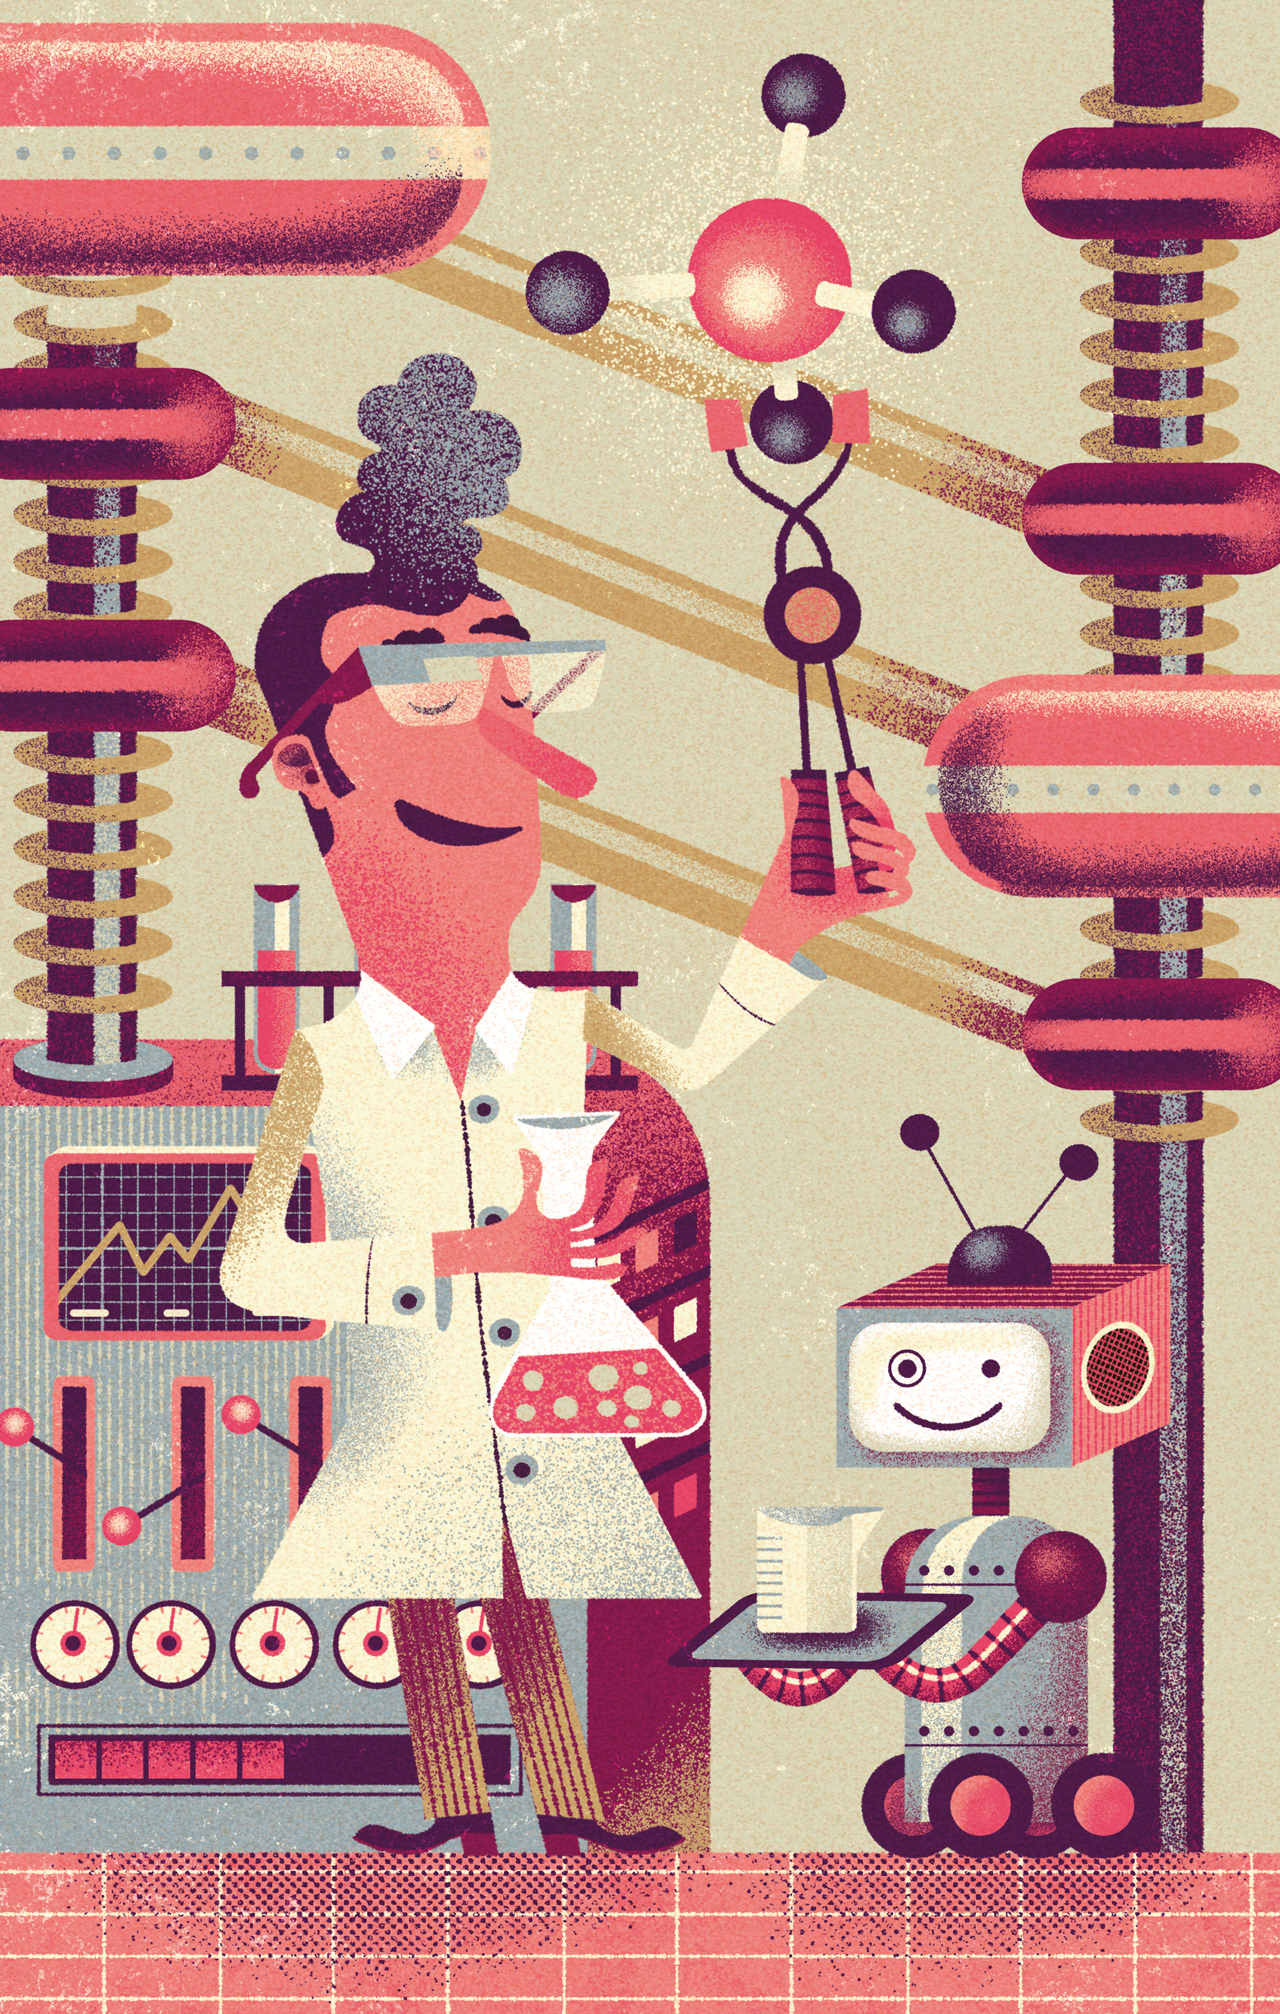
Art Direction
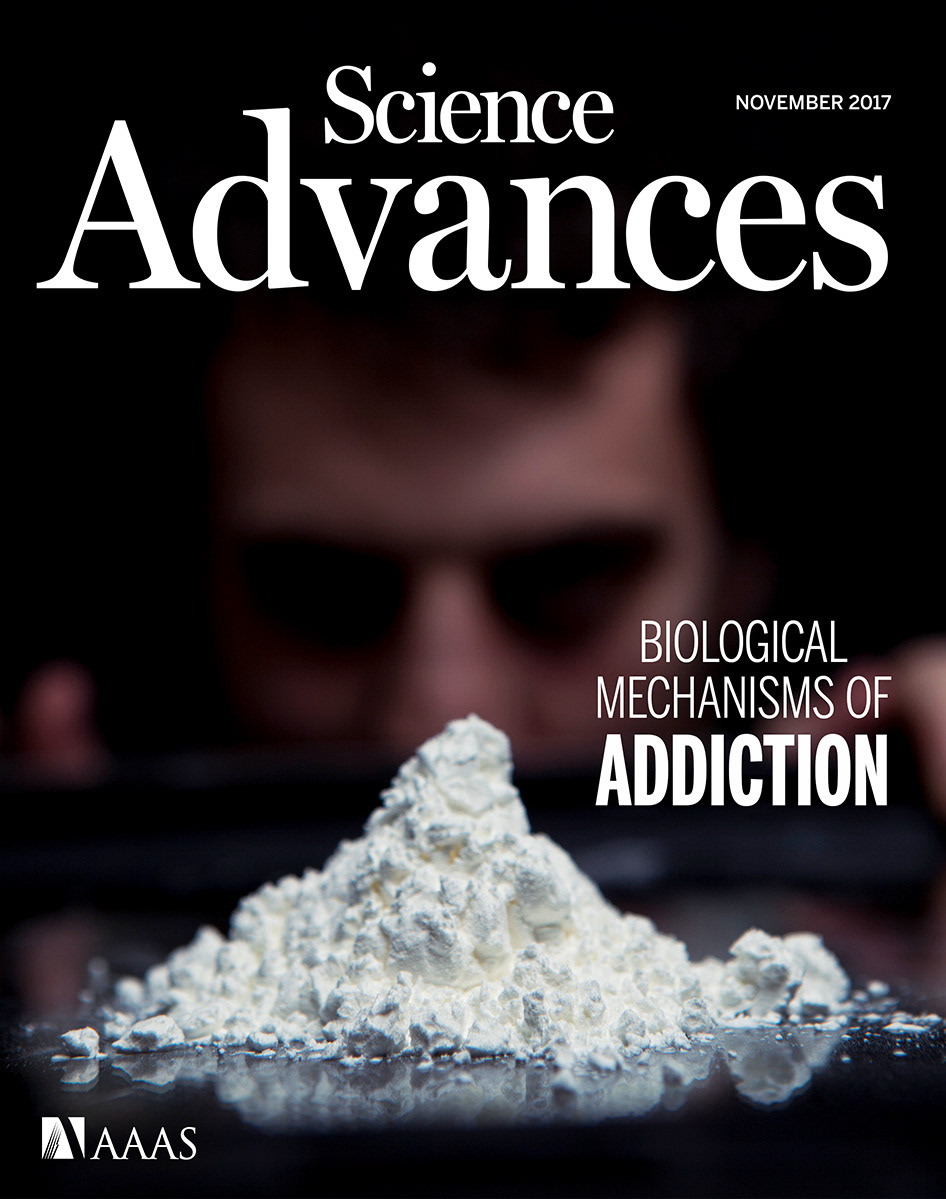
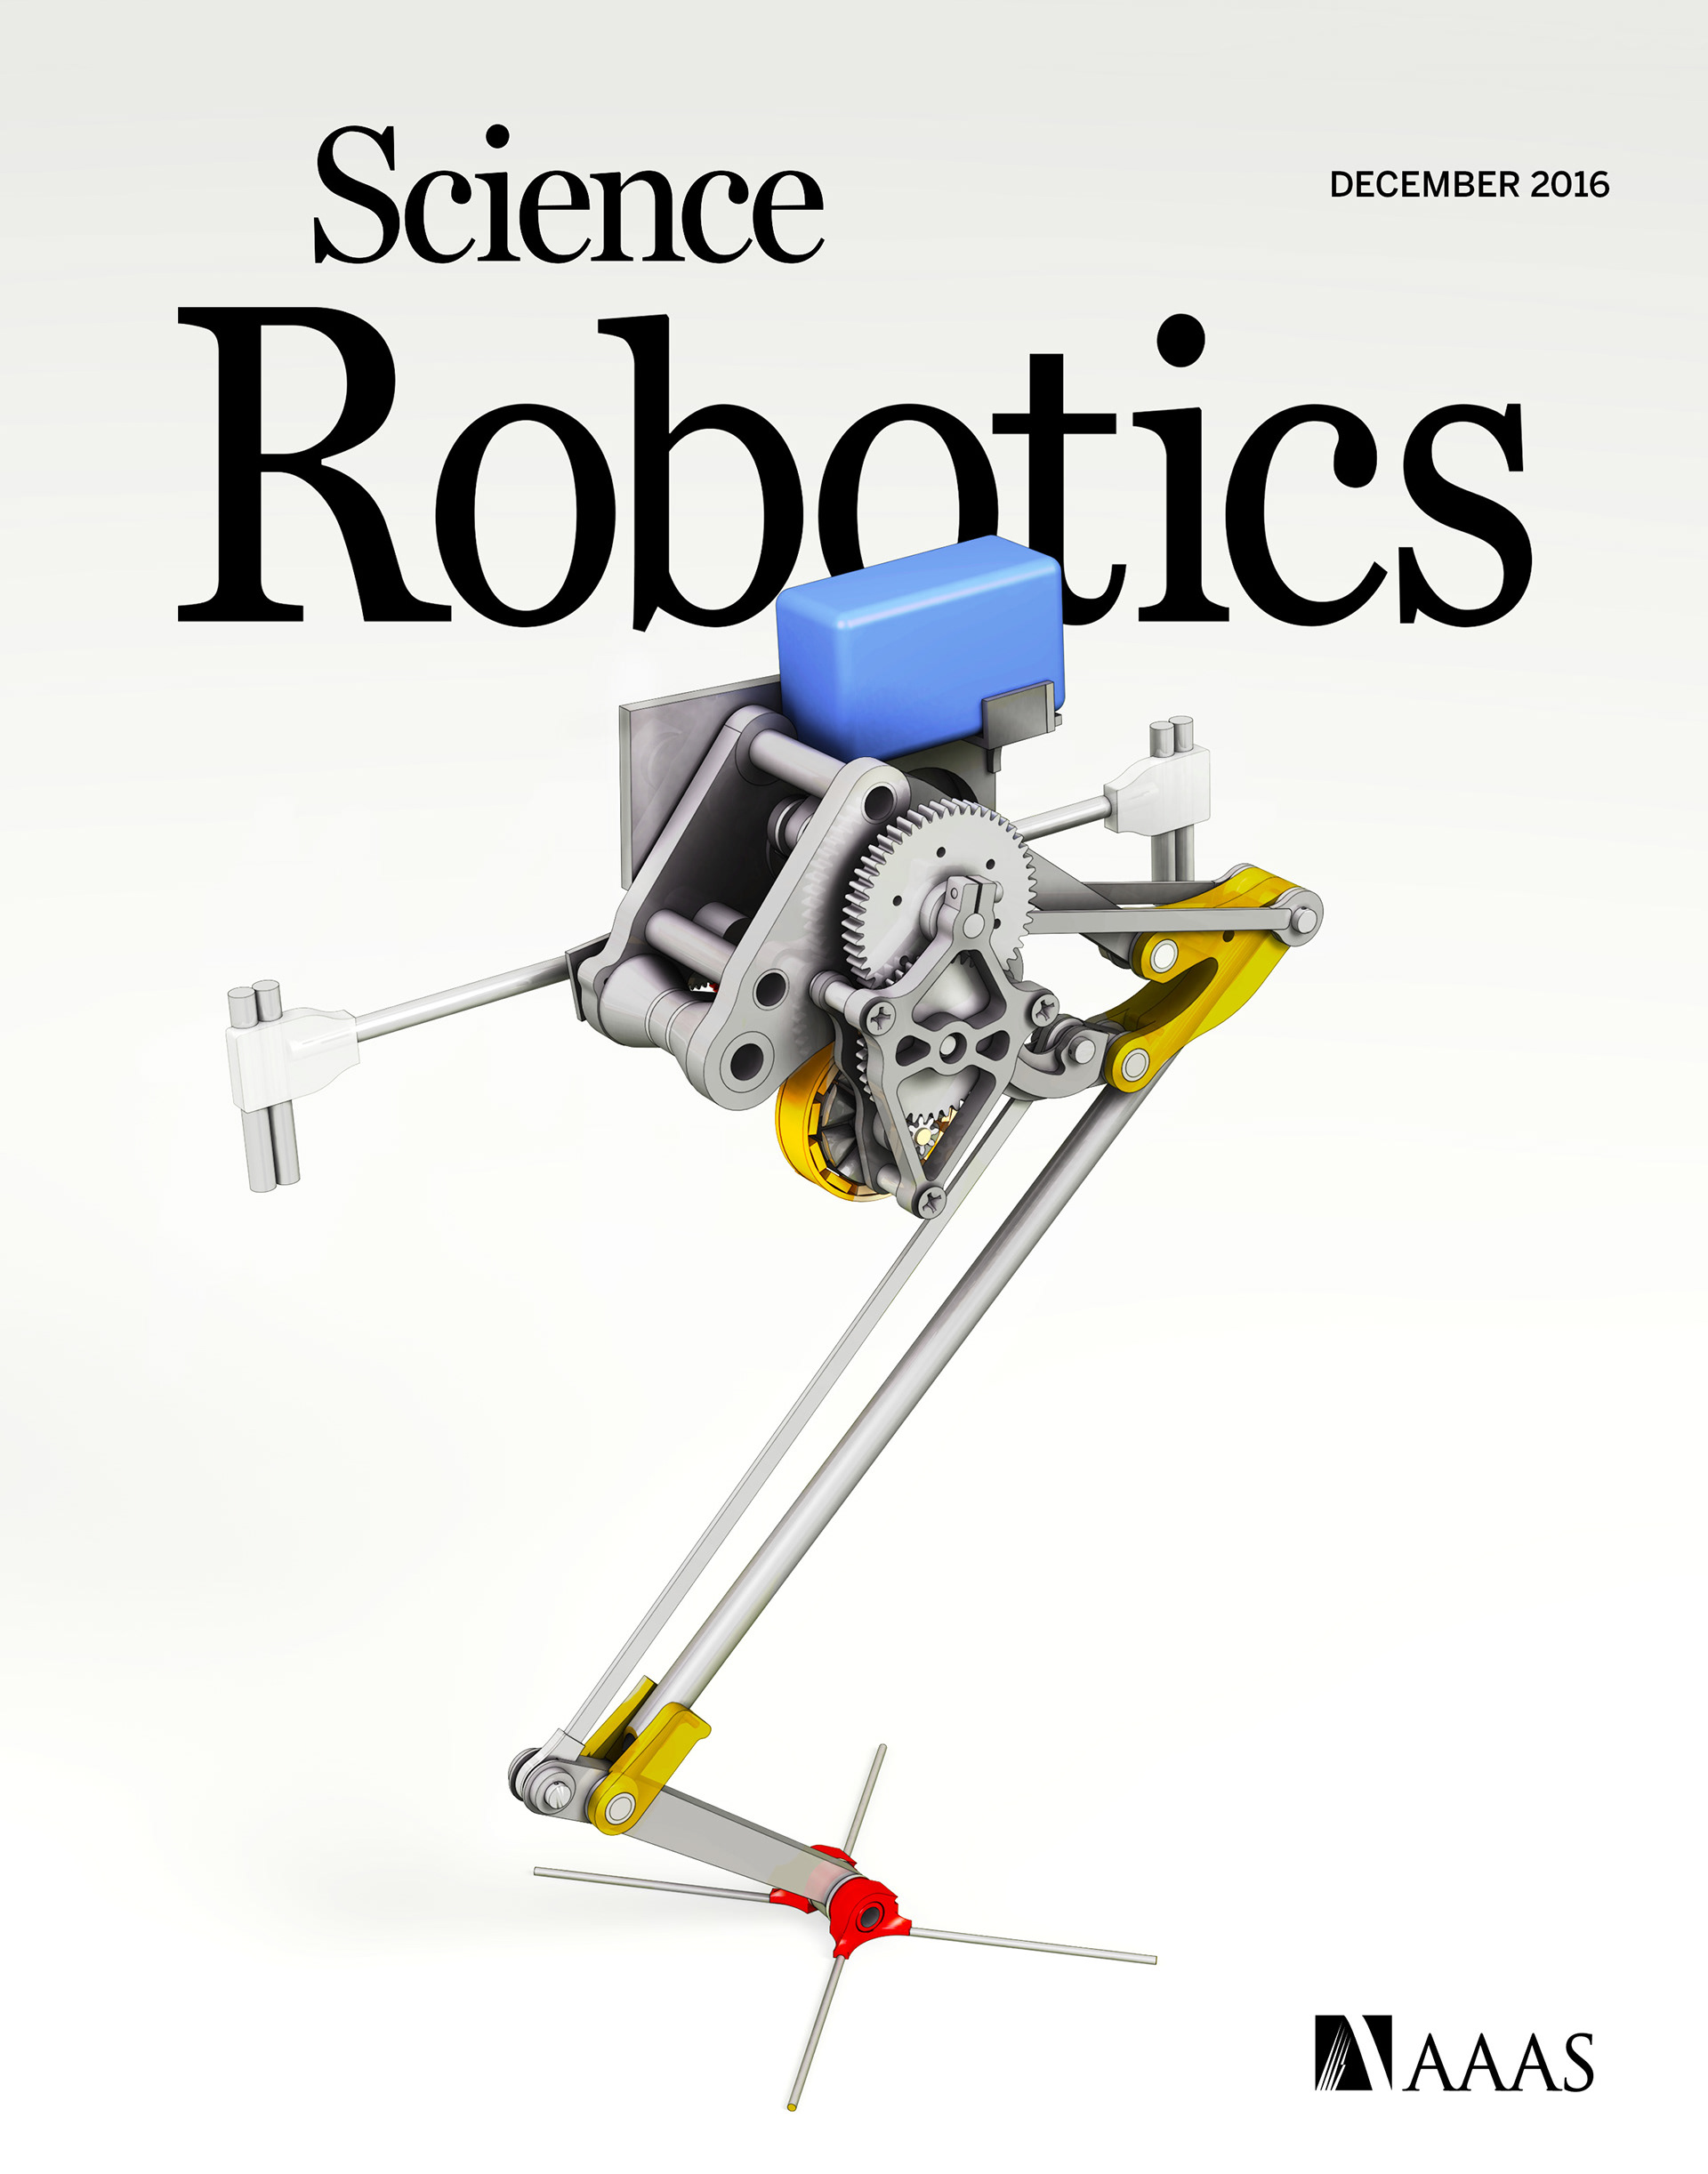
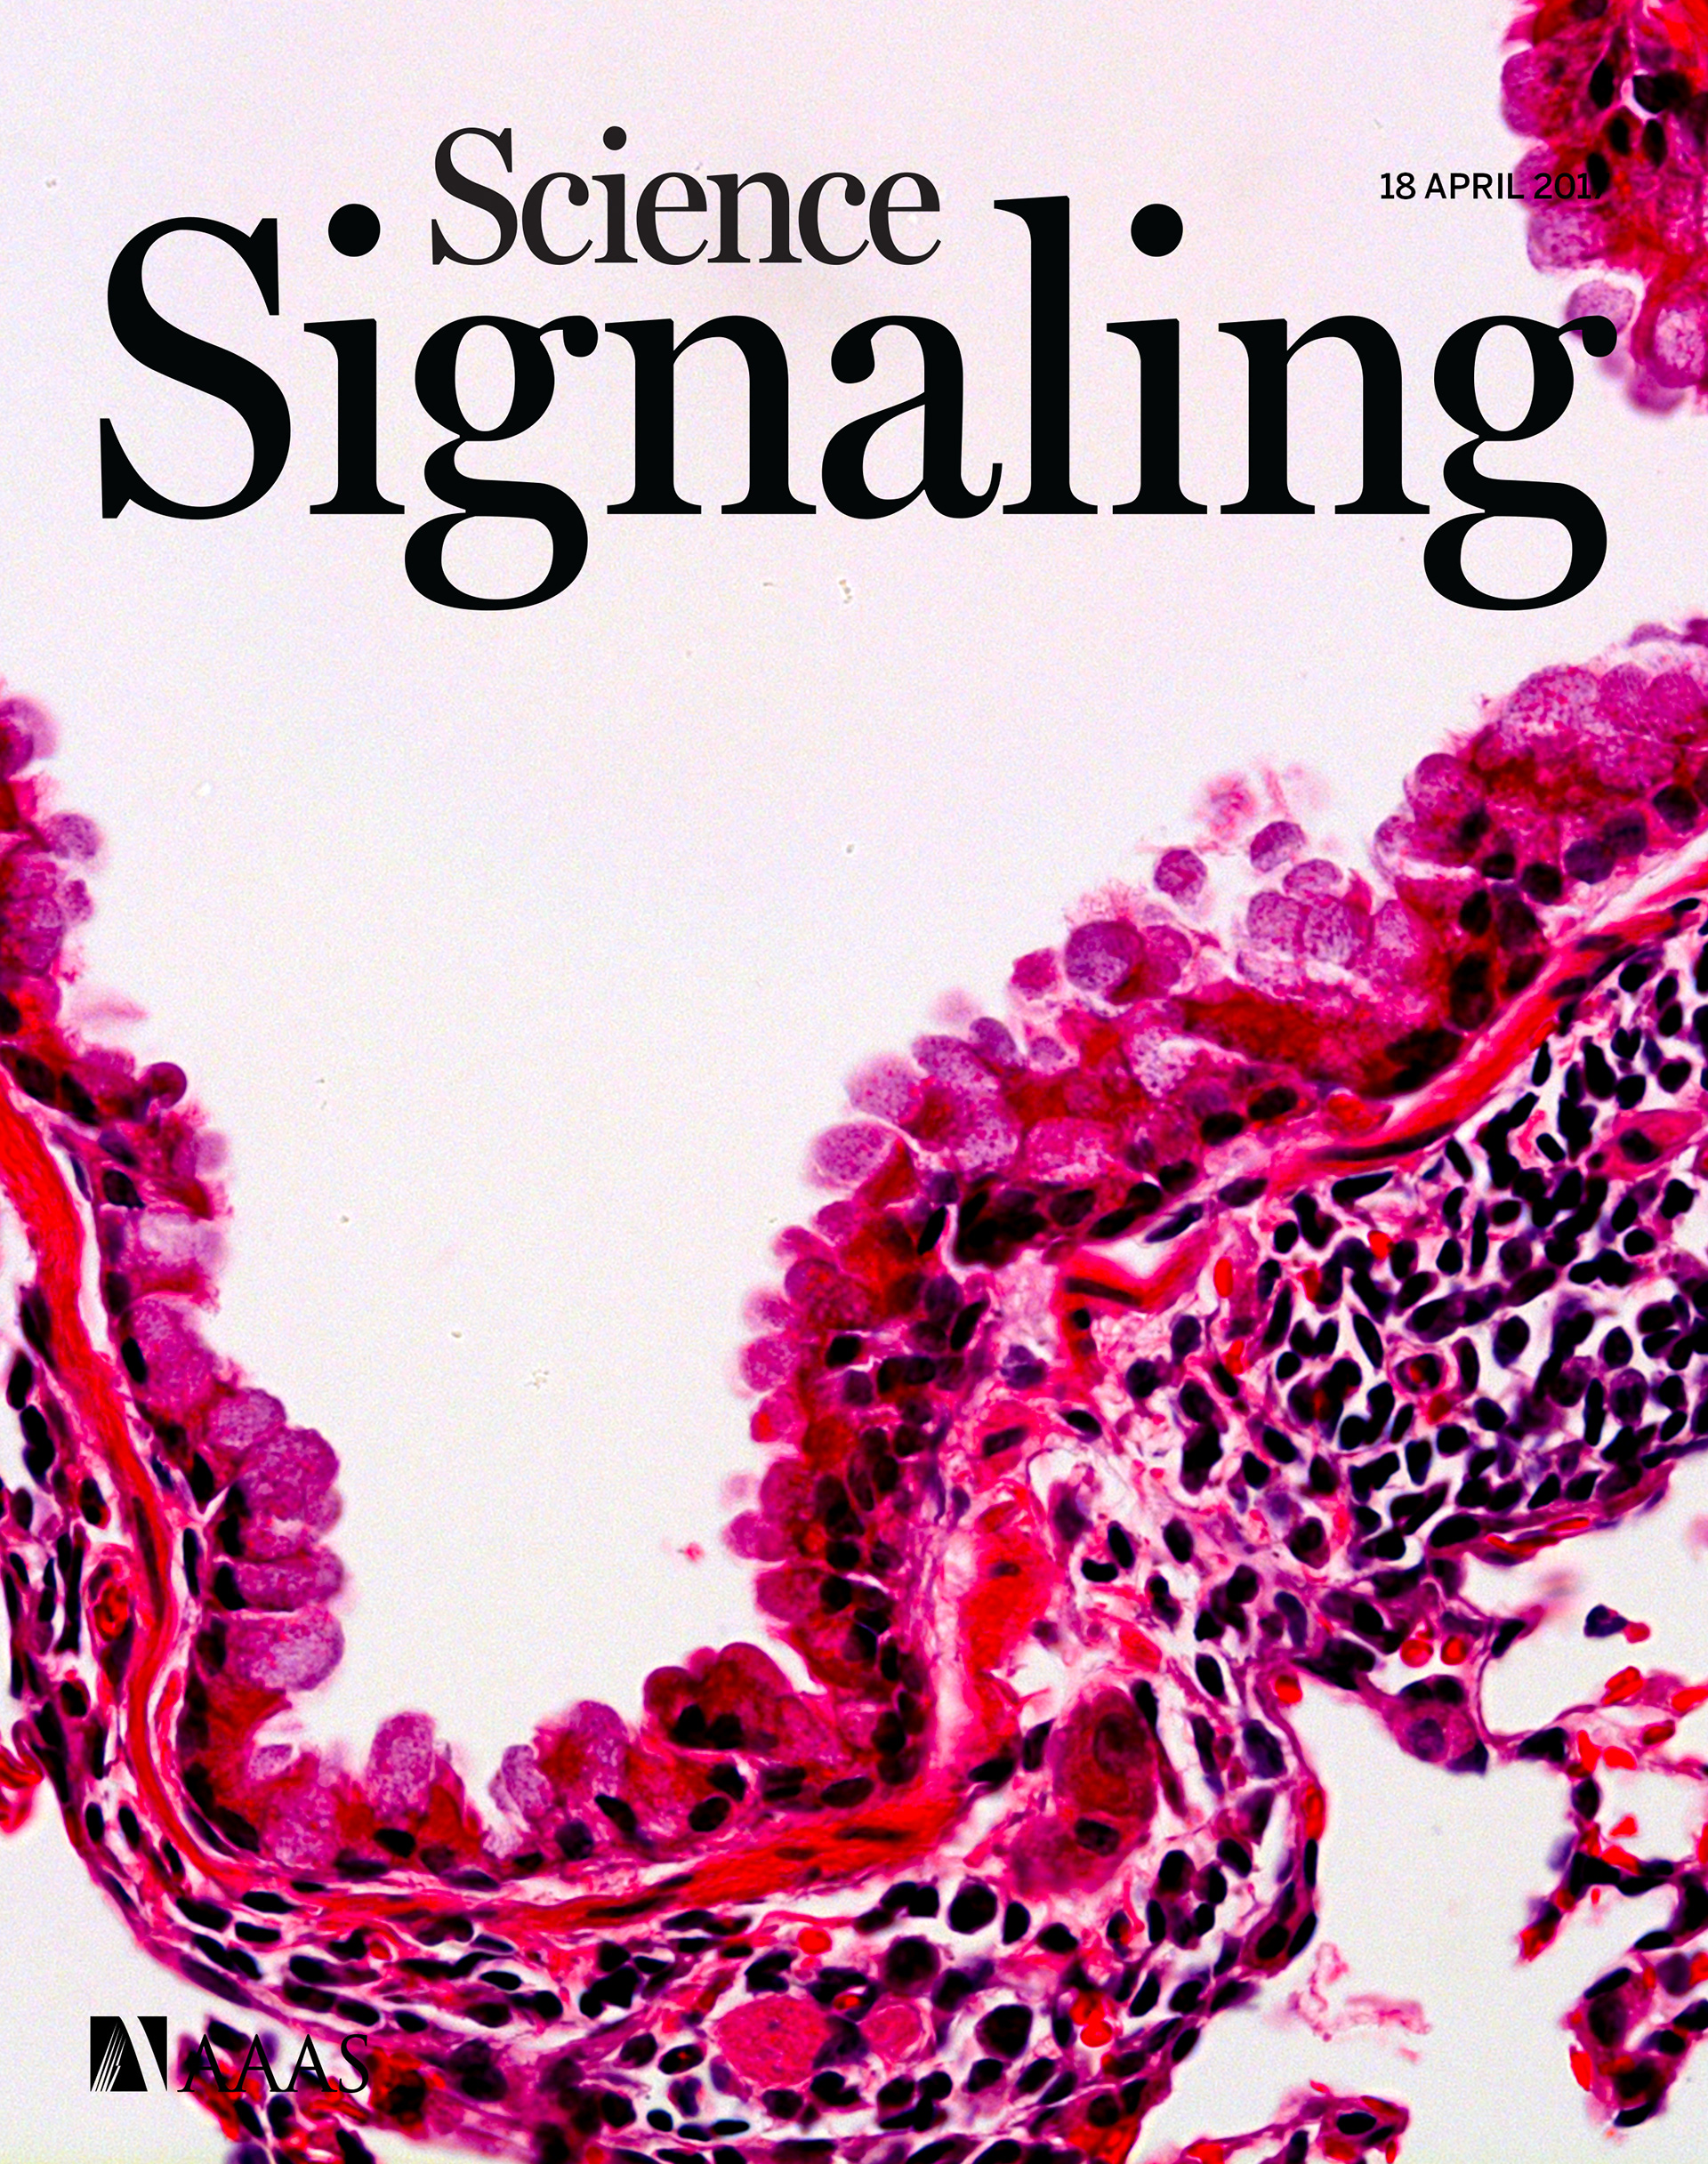


In addition to directing photo research and overseeing cover development for several of our secondary journals, I regularly collaborated with editorial artists to create illustrations for special issues.